Zero-result rate is the metric everyone reaches for first. It is easy to compute, it sounds like a defect count, and when it goes up someone asks the search team what happened.
I had been treating it that way for two days. Then I took the 231 query kinds that returned nothing and asked a different question of each one: does a product that would answer this query exist in our catalogue at all?
That is a database question, not a search question. It splits the same number three ways.
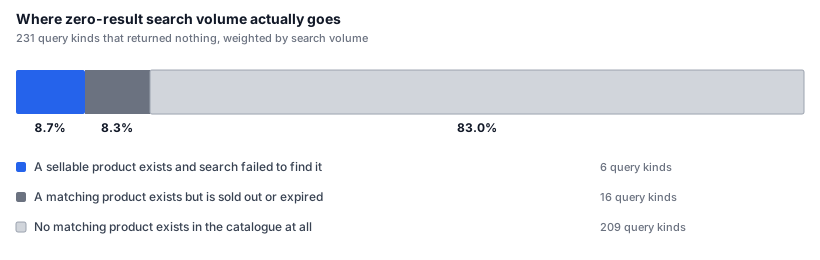
Every percentage in this post is weighted by search volume, not by query kind. The two axes disagree badly here: 209 of 231 kinds is 90.5%, but those same kinds are 83.0% of the volume, because the head of the distribution behaves differently from the tail.
What each slice is
A sellable product exists and search failed to find it. Six query kinds. These are real defects and I fixed them: the lexical index had the right answer at rank one and the fusion arithmetic threw it away. That is a separate story with its own numbers.
A matching product exists but is sold out or expired. Sixteen kinds. Nothing is broken. Someone searched for a destination we do sell, on a day when every departure for it had already gone. Search returning nothing is arguably correct, since offering a product you cannot book is worse than offering none.
No matching product exists at all. Two hundred and nine kinds. Not sold out, not mis-indexed. We have never had a product for these.
The third slice is not a search problem in any sense I can act on. No amount of query understanding, no embedding model, no fusion weight will surface a product that was never in the catalogue.
The boundary between the first two slices moves
I ran this decomposition twice, a day apart, with the same 231 queries and the same code.
Two query kinds moved from "sold out" to "sellable" overnight. Inventory rotated, departures were added, and the same query flipped category without anyone touching search.
The third slice did not move at all: same 209 kinds, same 83.0%.
That tells me something about which of these numbers I can quote. The 83% is a property of what we sell. The 8.7 / 8.3 split is a snapshot of a specific morning, and I should not have written it down without a date next to it. I nearly published the first day's numbers as if they were stable.
Inventory that exists but cannot be reached
The third slice looked like a sourcing problem until I checked the supplier API.
Our hotel supplier exposes a per-city endpoint that returns a curated list. For one domestic city it returns eight hotels. The same API's city index reports that city as having two orders of magnitude more.
I sampled 40 cities from the supplier's own city list and called the recommendation endpoint for each. One city in forty returned any hotel at all.
The endpoint is a curation surface, not a catalogue. It was never meant to enumerate inventory, and I had been reading it as though it were.
So part of that 83% is not "we do not sell it." It is "we sell it and I cannot see it from here." I cannot tell which part without a bulk endpoint the supplier does not currently offer, and that is now a conversation rather than a code change.
Four estimates I got wrong
Before I measured any of this, I made four claims about scale. All four were wrong, and three of them were wrong in the direction that made the work look more worthwhile.
| claim | how far off | direction |
|---|---|---|
| package inventory reachable | 6.4× to 13.6× | over |
| hotel catalogue expansion | 22.7× | over |
| cities with hotels available | said "most", measured 2.5% | over |
| daily refresh feasibility | said "impossible", it pages | wrong direction |
The first one has a specific cause worth naming. I estimated package inventory by sampling 25 representative product codes and multiplying by the total. I picked those 25 by search volume, descending, so I sampled the biggest products and extrapolated from them. A random sample of 60 gave a median of 28 sale products per code against a mean of 58, with 15% returning zero. The distribution is heavily skewed and my sample was drawn from its right tail.
An earlier post on this site describes the same failure in a different domain: an evaluation sample drawn top-down by repository count, which made a trivial baseline look strong. Same mistake, five months apart, and I did not recognise it while making it.
The fourth is the interesting one because it was wrong in my favour and I still nearly acted on it. I claimed daily status refresh at scale was infeasible, reasoning that one call per product meant one call per product. The supplier pages at 100 items per request, so the real figure is a hundredth of what I had assumed. I had used "infeasible" as an argument for a large refactor. It was not a reason.
Measuring what you cannot fix
The 209 kinds in the third slice are not noise. Stripped of single-character inputs, address pastes, and station-suffix queries that a separate change already handles, 146 kinds remain: people repeatedly searching for destinations we do not sell.
That list is not a search backlog. It is a sourcing brief, and it is the most useful artefact this measurement produced. It says, in real user demand ordered by volume, which destinations customers ask us for and leave without.
I spent two days improving search. The measurement that mattered most told me search was 8.7% of the problem, and that number was itself a snapshot that had already moved by the time I finished writing it down.