I have twenty-eight repositories and a stream of issue tickets, and the first question on every ticket is which repository it belongs to. Semantic search should be good at this. Embed the ticket, embed the code, rank the repositories by how close they sit.
It half worked, and the half that failed was more interesting than the half that worked.
The scores were all the same
Here is what routing looked like from the outside. Take a query, search each repository separately, average the top three chunk scores, rank the repositories by that average.
Every repository came back between 0.9244 and 0.9432. Every query. The whole discriminating range was 0.019 wide, and I was sorting twenty-eight things inside it.
My first read was that the embedding model just wasn't very discriminating on this kind of text: issue titles are short, code is code, and a multilingual model is going to find everything vaguely similar to everything. That read was wrong, or at least it was answering a different question than the one I should have asked.
The question I should have asked: is that 0.019 measuring anything at all, and if so, what?
It was measuring size
Each repository has a mean rank across the whole query set, meaning where it lands on average, regardless of whether it was right. Plot that against the log of how many chunks the repository has.
Correlation between log(chunk count) and mean rank: r = -0.784 across 28 repositories. Negative because a lower rank number is better. Bigger repository, higher up the list, for every query.
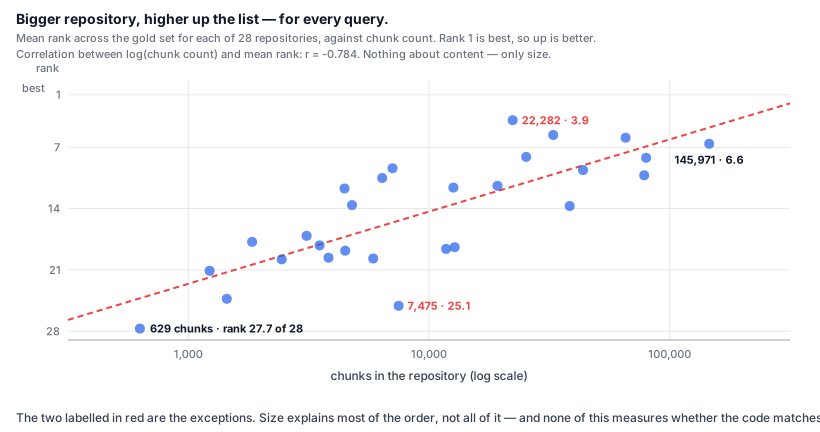
The two that break the pattern are worth as much as the trend. A mid-sized repository sitting at 25.1 and another at 3.9 mean size is not the only thing in play. It is just the thing that moves most of the order.
That is most of the signal. The 0.019 I was sorting on was, to a first approximation, a size ranking with some relevance noise on top.
Why this happens is mechanical, not mysterious
Take the top three chunks and average them. That is a max-of-k statistic, and max-of-k grows with the sample size. A repository with 145,971 chunks gets 145,971 chances to produce something that lands close to the query by accident. A repository with 629 chunks gets 629 chances.
Neither number has anything to do with whether the answer is in there.
It is the same reason the tallest person in a city is taller than the tallest person in a village, and it tells you nothing about the average height of either. I was ranking cities by their tallest resident and calling it a measure of the population.
The smallest repository in my set landed at mean rank 27.7 out of 28. It is not a bad repository. It never had a chance.
One line of that is measured and one is not. The correlation is. That max-of-k sampling is what produces it is inferred: consistent with the number, but a different claim. The test that separates them holds chunk count fixed and varies the content, and I have not run it. So the section title above is more confident than what sits under it.
Three ways to fix it, all worse
The diagnosis suggested an obvious cure: take the size out. I tried three shapes of that, measured each against the same gold set, and all three were worse than doing nothing.
Normalize each repository against its own score distribution. Compute the mean and standard deviation of the scores a repository produces across many queries, then rank by z-score instead of raw score. Standard practice in federated retrieval, where different collections have different score scales.
Correct answer in first place went from 28% to 12%.
I had an explanation for that and it was wrong, which I only found out by going back to measure it. My story was that small repositories have narrow score distributions, so a tiny bump reads as a large z-score. Plausible, and false: across 28 repositories the per-repository standard deviation sits between 0.004 and 0.007, and its correlation with log(chunk count) is 0.167, so size does not predict spread. The smallest repository and the largest differ by 0.0009 in standard deviation, and that gap sits inside the band all twenty-eight occupy: two points, not a trend.
What z-scoring actually removes is each repository's mean, and the mean was doing work. It correlates with how often that repository is the correct answer at all (r = 0.448 over the same 28). The repositories that score high on average are the ones tickets are usually about.
I cannot cleanly separate that from size, and I want to be explicit about it: in this corpus the big repositories are also the ones with the most tickets, so mean score, chunk count, and answer frequency are three views of a tangle I did not manage to pull apart. What the numbers do support is narrower than my original claim. Subtracting the per-repository mean threw away a prior that was carrying real signal, and the noise-amplification story I told myself was not in the data.
Score the margin instead of the level. If a repository really contains the answer, its best chunk should stand out from its own tail. So rank by top-1 minus the mean of the rest, rather than by top-1.
Mean rank of the correct repository went from 3.9 to 16.4. This one I was confident about, and it was the worst of the three.
A peaked distribution is not evidence of relevance. It is evidence of a repository whose contents are homogeneous: one framework, one directory shape, one style. The margin was measuring internal variance, which correlates with nothing I cared about.
Count relevant chunks instead of scoring the best one. Pool every repository's results into one global ranking, take the global top fifty, and score each repository by how many of those fifty it contributed. This is the shape of ReDDE, which estimates how many relevant documents a collection holds rather than how good its best one is.
Top-5 went up three points. First place went from 28% to 12%.
Counting has the size problem by design, since a bigger repository contributes more of the global top fifty for the same reason it produced a higher maximum. ReDDE assumes that is what you want, because in federated search it usually is: a collection with more relevant documents is a better collection to query. Here I wanted the one repository to edit, and "has more matching chunks" is a different question from "is the one".
What the failures had in common
Every fix tried to correct the comparison. None of them questioned what was being compared.
The unit was a code chunk, and the number of chunks per repository ranged from 629 to 145,971, a factor of 232. Any statistic computed over that unit inherits the spread, and no amount of normalization removes information the statistic never had.
So I changed the unit. Instead of asking each repository's code to answer, I gave each repository a short description (what it is, who uses it, what it holds) and put those descriptions in their own index. One document per repository. Same length for all of them. Nothing to be big about.
That index ranks repositories on its own, and the code ranking still exists, so the obvious move is to fuse them.
I had tried exactly that before and it lost. Fusing a summary ranker with the code ranker made routing worse, and I wrote up why: reciprocal rank fusion gives a candidate a contribution from every ranker that returns it, so anything one ranker cannot see is structurally penalised. My summary matcher was blind to 11 of the 28 repositories, and fusion deepened the blind spot it was supposed to fill. The conclusion at the time was that fusion is correct only when both rankers could have ranked everything.
Descriptions have that property and summaries did not. There is one per repository, written whether or not the repository has any screens to summarise, and every repository is therefore rankable by both sides. So the condition I had named as the failure was now met, and the same operation that lost before wins:
The interesting row is the middle one. Descriptions alone, with no code search at all, matched code search on first place and beat it on recall, and a description is three sentences someone wrote once, against an index of two hundred thousand code chunks.
The other thing worth saying plainly: I did not fix fusion. Fusion was never broken. I fixed the input that was missing half the collection, and the technique that had failed twice started working without a line of it changing.
Then I made the descriptions worse by improving them
A description index worked, so the obvious next move was better descriptions. I tried four rounds of that and three of them lost.
The descriptions started as a label and a role: what the repository is, who uses it. Adding the names of its top-level directories helped, and helped a lot: first place went from 42% to 51%, answer-in-top-5 from 92% to 94%. Directory names are things like air, codingmap, html_member: ugly, internal, and specific to exactly one repository.
Then I added tags generated by a language model reading each repository, then a filtered version keeping only the tags that appear in few repositories, then a hand-written glossary. All three lost, and I am giving them as one table rather than as a running commentary, because I first reported them as a sequence and the sequence is what misled me.
One sitting, one change at a time, every build written into the same directory so that nothing but the description text differed between them:
One caveat about reading those as absolute numbers: they belong to the index they were measured on. The same builds made in a different directory come out about a point apart, which turns out to be a story of its own.
Filtering the tags by document frequency helps and does not rescue: unfiltered tags cost eight points of first place, filtered tags five. That is the IDF idea working as far as it can work here and no further.
Then I added a hand-written glossary of internal product names, the words people actually use in tickets, which appear nowhere in the code. This one I was sure about. The vocabulary gap was real, and I had read a run of failures as tickets not reaching the right repository for lack of exactly these words (read, not traced, which turned out to matter). First place fell three points, not the twelve I first wrote down. The twelve came from comparing a build carrying the glossary and the tags against one carrying neither, so most of it belonged to the tags. Two changes, one attribution, and the number I published was four times the effect.
The pattern took me too long to see. Everything that helped was unique to one repository. Everything that hurt was shared across several. My product names are shared by construction: one brand covers four repositories, one product line covers six. Writing that shared word into six descriptions does not tell the search which of the six to pick. It makes those six look more alike, which is the opposite of what a ranking needs.
Inverse document frequency is the standard answer to this, and BM25 has applied it for thirty years. What I had not internalised is that IDF only discounts a common term at query time. If the term is in the document at all, it is still contributing to the dense vector. For an embedding index, the filtering has to happen when you write the document.
So the rule I ended up with is narrower than "write good descriptions": write what distinguishes this repository from its neighbours, and leave out what it shares with them, even when the shared thing is true and useful and you typed it yourself.
About that gold set
You cannot measure a bias like this with a convenient sample, and my first gold set was a convenient sample.
I had built it from my own commit history: tickets I had worked on, with the repositories I had touched as the answer. Eighty-three items, which sounds fine until you look at the distribution. Four repositories accounted for essentially all of the correct answers, because those are the four I work in. Measuring "do big repositories win unfairly" on a set where the answer is almost always one of four repositories does not measure anything.
The replacement is built from every repository's git history rather than mine. Scan all of them for commits carrying a ticket key, group by key to get the set of repositories that ticket actually changed, then pull the real ticket titles so the queries are what people wrote rather than what I wrote after fixing it. From the full ticketed history, sample so that repositories are represented evenly instead of by how often I happened to touch them.
That gives 90 tickets covering 16 repositories, a median of nine tickets per repository, ranging from one to forty-four. Every ticket has two or three correct repositories rather than one, because the balanced sample skews toward tickets that crossed boundaries, which are the hard cases anyway.
It is still not a clean instrument. Sixteen of the twenty-eight repositories appear; the other twelve have too little ticketed history to sample from, and they are disproportionately the small ones, exactly the group the bias hurts. The correlation is computed over all 28, which is enough for the sign and the rough magnitude and not enough to argue about the third decimal.
One more thing about the instrument, because it caught me twice.
My analysis table had twenty-nine rows in it, and routing only ever queries twenty-eight. The script that computed the correlation walked every repository with an index on disk; the router walks the ones marked active in the config. One repository is indexed but switched off, and my measurement had been quietly including it in a ranking it never appears in. Nobody notices an extra row.
That row also sat at the bottom of every table I produced, and the reason turned out to have nothing to do with its contents: a migration had left it on an older embedding model, so its scores were not on the same scale as anything I was comparing them to.
Both of those are the same mistake in different clothes: the set I was measuring was not the set I was serving, and neither error announced itself.
What I would check first now
If you are ranking collections by embedding similarity and the scores look flat, correlate your ranking against collection size before you touch the ranking function. It is one line and it tells you whether you have a scoring problem or a units problem.
If it is a units problem, normalization will not save you. Find something you can compare that is the same size for every collection.