For about a week I believed I had taken an agent's routing accuracy from 73% to 90%. I had a harness, I had numbers, I had a changelog of prompt edits with the score after each one.
Then I ran one more configuration, mostly out of curiosity: what happens if the system ignores the ticket entirely and always answers with the same three repositories?
That scored 95%.
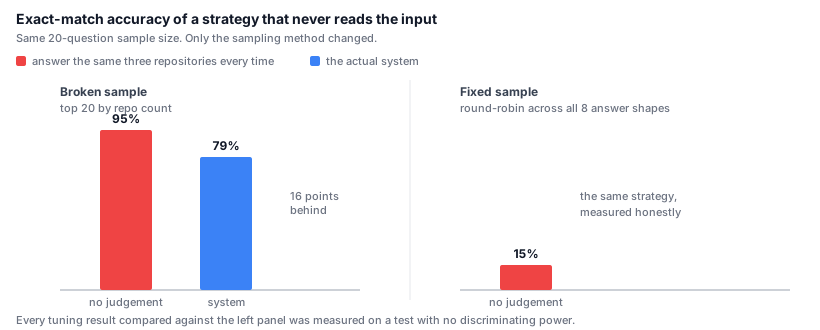
Everything I had measured that week was measured on a test where doing nothing beat doing something. Not by a little. By sixteen points.
What the system does
A bot picks up a ticket and has to decide which repositories need changing before it touches anything. Get that wrong and every step after it is wasted: it writes correct code in the wrong place, or it never opens the file that mattered.
The corpus is roughly thirty repositories. The answer for a ticket is usually one or two of them, sometimes three, occasionally none because the work was already deployed.
Where the ground truth came from
I didn't want to hand-label, so the answer key is built from git history: find commits whose message references a ticket ID, collect the repositories those commits touched, and call that the answer. That gave 117 tickets with known answers.
This part I still think is reasonable. The problem was one layer up.
How the sample was drawn
Running all 117 through an agent takes long enough that I sampled 20 for iteration. The harness picked them in descending order of how many repositories the answer contained, which sounded sensible when I wrote it, since bigger answers are harder, so tune against the hard ones.
Here is the distribution I did not look at:
| Answer shape | Tickets |
|---|---|
| three repositories (a specific trio) | 19 |
| everything else, across 7 other shapes | 98 |
Nineteen. My sample of twenty was nineteen tickets with an identical answer plus one straggler.
At that point the test no longer measured routing. It measured whether you would say the same three repositories over and over, and the fastest way to score well was to not think at all.
What "not thinking at all" scored
I ran a strategy that ignores the ticket text completely and always emits those three repositories.
| Exact | Recall | Precision | Stability | |
|---|---|---|---|---|
| no judgement at all | 95% | 100% | 98% | 100% |
| the actual system | 79% | 92% | 96% | 79% |
The system I had been tuning lost on every column. Stability is the one that stings: the null strategy is perfectly consistent by construction, while a real model varies run to run, and on a test like this that variation can only cost you.
I want to be precise about what this does and doesn't mean. It does not mean my changes had no effect. It means none of them had ever been tested. A week of measurements, all taken with an instrument that could not tell the difference between working and not working.
About that 90%
Someone will notice that I opened with 90% and then put 79% in a table, so let me be straight about it.
I cannot tell you today what the 90% measured. It's in my tuning log with a date next to it, and I no longer know whether it was exact match, recall, or some blend I was using that week before I settled on reporting all four columns. The 79% in the table is exact match on the broken sample, measured later, when I had fixed what I was reporting but not yet what I was sampling.
I could go back and reconstruct it. I decided not to, because the honest answer is more useful than the reconstructed one: numbers produced by a broken instrument leave the number behind but not the meaning. I have the 90% and I don't have what it was 90% of.
That's the part that doesn't show up in the postmortem summary. The lost week is annoying. The lost interpretability of everything measured during it is worse, because it means I can't even mine the old runs for signal now that I know what was wrong.
Fixing the sample
The fix was small: instead of sorting by answer size, walk the answer shapes round-robin so all eight are represented in the twenty.
Same sample size, same source data, same cost to run. On the new sample the null strategy drops from 95% exact to 15%, and from 100% recall to 55%. That's a test with discriminating power: a system that actually reads the ticket can now demonstrate it.
The line that saved me a day
The real change wasn't the sampling code. It was this: the harness now computes the null baseline on every run and prints it above the results.
If the run doesn't beat the line above it, the harness says ** measured nothing ** instead of reporting a score.
It's four lines of code and it makes the failure impossible to miss. Before, the number looked fine. 79% is a plausible-sounding accuracy, the kind you screenshot into a status update. Nothing about it announced that a rock would have scored higher.
The uncomfortable question underneath
There's a reading of this that I had to sit with for a while.
Nineteen of the hardest tickets had the same three-repository answer. That is not random. Those three repositories are a front end, its legacy predecessor, and a shared admin surface, and in this organisation they genuinely do change together, because a feature that touches one usually touches all three.
So when the null strategy scores 95%, is the test broken, or is the task just easier than I want to believe?
Both, and separating them matters. The task really does have a dominant answer, and a system that never learned anything except "usually those three" would be right a lot of the time in production. That's a legitimate thing to know about your problem.
But a test whose job is to tell good systems from bad ones cannot be built out of the dominant case alone, because on that sample every system converges to the same answer and the differences you care about disappear. The round-robin sample is not more realistic than the original. It is deliberately less realistic, weighted toward the cases where systems can actually differ. That's what a discriminating test is for.
The production question ("what do we answer most of the time") and the evaluation question ("can this system tell cases apart") pull in opposite directions, and I had accidentally built an evaluation set that answered the first one. Once I saw it that way, the fix stopped feeling like a bug fix and started feeling like deciding what the test was for.
Why this is easy to walk into
None of the individual decisions here were stupid, which is what makes it worth writing down.
Building ground truth from git history is a good idea. Sampling for iteration speed is a good idea. Sampling the hard cases first is a defensible idea. The failure only exists in the interaction between the last two and a distribution I never printed.
And the sample was doing exactly what I asked. It just turned out that "the tickets with the most repositories in the answer" and "the tickets with one particular answer" were nearly the same set in this corpus, and I had no reason to suspect that until I looked.
The general shape: a benchmark can be broken in a way that makes your system look good, and nothing about a good-looking number tells you which kind you have. Failing tests announce themselves. Meaningless tests do not.
What I check now, on any benchmark
Print the answer distribution before you sample. One line of output. If a handful of answers dominate, no sampling method fixes that on its own and you need to know before you interpret anything.
Implement the dumbest possible strategy and score it. Always the majority class. Always empty. Always everything. Whatever "no judgement" means for your task, that number is your floor, and any result that doesn't clear it by a comfortable margin is noise.
Put the floor in the output, not in a notebook. A baseline you have to remember to check is a baseline you will forget to check on the day you most want the number to be good.
Be suspicious of your best result, not your worst. Bad numbers get investigated. Good numbers get shipped into a slide. The week I lost was a week of good numbers.
The part where I got lucky
I should be clear that I did not find this through rigour.
I ran the null configuration because I was curious what would happen, on an afternoon when the tuning had stalled and I wanted to look at something else for twenty minutes. There was no hypothesis. If the tuning had been going well that week I would not have gone looking, and the 90% would have gone into a document and then into everyone's assumptions.
That's the argument for making the baseline automatic rather than remembering to check it. Rigour that depends on curiosity is not rigour. It's a coin flip that happened to land well.
What it cost, honestly
Roughly a week of tuning that produced no evidence. The prompt changes may well have helped, but I no longer know which ones, because they were all evaluated with the broken instrument. I re-ran the important ones afterward on the fixed sample and some held up. Some didn't.
The uncomfortable part is that I only found it because I got curious about a null configuration on a slow afternoon. There was no failing test, no crash, no red mark anywhere. If I hadn't run that one experiment I would still be citing 90% today.