To sweep search parameters you need a cheap arm. Mine started at five to seven minutes per combination, which makes an eighteen-combination grid a two-hour job and means you run one grid a day and think hard about which one.
So I cut the evaluation set to the top 400 queries by volume and built a harness. One of the decisions I made on that set was wrong, and it was wrong in a way the set could not have shown me.
The parameter that made no difference
Hybrid retrieval pulls some number of candidates from the vector side before fusing. The default was 50. Fewer means less database work. I swept it across twelve combinations on the 400-query set.
| vector candidates | rank-1 hits (of 400) | objective |
|---|---|---|
| 20 | 283 | 83.53 |
| 30 | 283 | 83.53 |
| 50 | 283 | 83.52 |
| 80 | 284 | 83.59 |
One hit apart, across a four-fold change in the parameter. The zero-result rate was 1.92% in all four, identical to the decimal.
I read that as this parameter does not affect quality. Which makes dropping 50 to 20 free: same output, forty percent less vector work per query.
It was not free
Before committing anything I re-ran the finalists over the full 1,500-query set. Four arms, each one change from the last.
| arm | zero results | rank-1 hits (of 1,500) |
|---|---|---|
| A original | 199 kinds, 4.61% | 695 |
| B new fusion weights | 194 kinds, 4.32% | 698 |
| C plus retuned cutoffs | 194 kinds, 4.32% | 700 |
| D plus 20 vector candidates | 194 kinds, 4.32% | 693 |
Arm D is arm C with the one change the grid had called free. It cost seven answers: nine queries lost, two gained. Measured against the original baseline it produced six improvements and eight regressions.
Fewer vector candidates costs recall. I wrote here that the losses would be in the tail, reasoning that popular queries are reachable through either retrieval path. I went and looked, and that was wrong. Eight of the nine sit between rank 285 and rank 856 by volume, the band just past where the grid stopped looking. Only one is a genuinely rare query, at rank 1,412.
The 400-query set did not miss these because they are obscure. It missed them because it stopped at 400.
Counting the same 1,500-query set at every prefix shows where the tie ends:
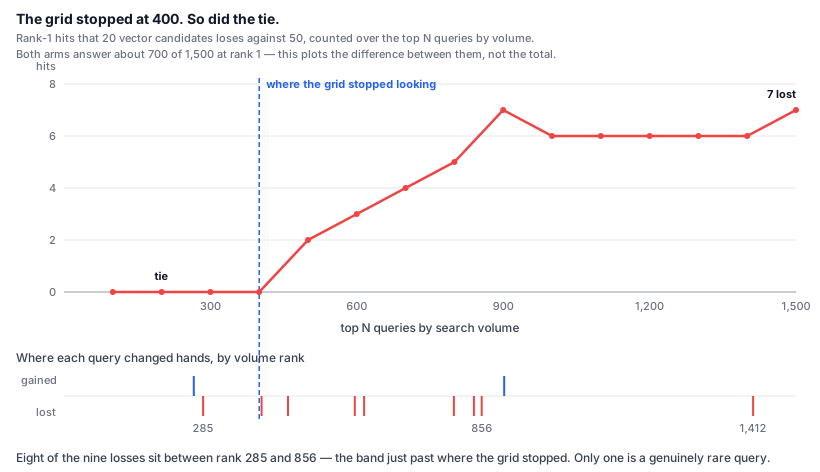
Each of those fifteen points is a recount of the stored per-query results, not an interpolation between two ends. One caution about reading it: the 400 mark on this curve is not the 400-query grid from the table above. That grid was a separately collected set. This is the top 400 of the validation set, and it scores 287 against 287 rather than 283 against 283. The same shape appears in both, which is the point, but they are two measurements, not one measurement extended.
The tie at 400 was not luck either, and the detail is better than "underpowered." Inside the top 400 there is exactly one loss (rank 285) and exactly one gain (rank 266), and they cancel. From 401 onward D loses eight more and gains one. The sample did not fail to detect a difference; within that sample the difference was genuinely zero. It just did not stay zero.
The baseline is a measurement too
One thing about this table needs saying, because it undercuts a reader's ability to compare it against my other numbers. This 1,500-query set is not the same 1,500 queries I used elsewhere. Between the two runs I recollected the query log with finer time slicing, which surfaced kinds the coarser pull had buried, and 91 of the top 1,500 were replaced, six percent of the set.
The baseline moved with it: the same unchanged configuration scores 198 zero-result kinds on one set and 199 on the other, 698 rank-1 hits on one and 695 on the other. Nothing in the code changed between those two numbers.
That is the same lesson as the rest of this post, one level up. A baseline is a measurement, not a constant, and swapping six percent of the evaluation set moves it by about as much as a real change does.
This is not "the winner flipped"
The precise version matters, because the imprecise version suggests the grid lied.
It did not. Twenty and fifty differed by one hit out of four hundred. That is not the same; it is below what four hundred queries can resolve. The grid reported a difference it could not measure, which is the correct thing for it to do. I turned that into "no difference" and then into "so the cheaper one is free."
A tie in an underpowered test is not evidence of equality. I knew that in the abstract and still spent an afternoon acting otherwise.
There is an earlier post here about a sampling failure that looks similar and is not:
The first is a sample that does not represent its population. The second is a sample with no power to separate two conditions. Different failures, and the second one hides better, because a tie looks like an answer.
Turn off the result cache before you sweep anything
The first thing I ran against the harness was not a measurement. It was a check that changing a parameter changed the output at all. It printed this:
The recommendation service caches results per query. With that on, the second arm of every comparison replays the first arm's answers.
Inferred: had I not checked, all eighteen combinations would have returned identical numbers and I would have concluded that none of those axes mattered. I did not run it that way to confirm, because by then I knew why it would happen.
The same session produced the mirror image of that problem. Two different fusion changes reported identical zero-result figures: 193 kinds, 4.24%, to the decimal. A reviewer asked whether I had copied a row. I had not: both changes lift a lexical-only document over the same arithmetic cutoff, so the same set of queries escapes zero results either way, and only the ordering differs.
Two numbers that agree too well are a signal. They can point at a caching bug or at a real shared mechanism, and the only way to tell is to open both lists.
The bottleneck was not where I looked
Getting from five minutes to a hundred seconds per arm did not come from the vector search or the BM25 scoring. Those were the expensive-looking parts.
It came from promotion matching, which was running BM25 over the entire promotion corpus on every query. That computation has nothing to do with fusion weights and produces the same answer on every arm. Memoising it removed about half the runtime, and the rest came from caching the vector and lexical fetches the same way.
The general shape: in a parameter sweep, cache everything the parameter cannot reach. Working out which parts those are took me one profiling pass and taught me more about the pipeline than the sweep did.