One morning my coding agent stopped answering. I asked it to continue. Nothing. I asked if it was alive. Nothing. Nineteen minutes later I gave up and forced a manual compaction, and it came back.
The transcript of those nineteen minutes is preserved, which is a strange thing to read afterwards:
I went looking for what happened. What I found was not a bug.
The session was 80 days old
Other sessions on the same machine were 1 to 18 MB. This one had been running since mid-June, across every project I'd touched since.
I hadn't decided to keep it open. It just never occurred to me to close it. It had context, it knew things, starting fresh felt like throwing away work.
Fifty compactions, all from the same place
The interesting number isn't fifty. It's what the context looked like immediately before each one:
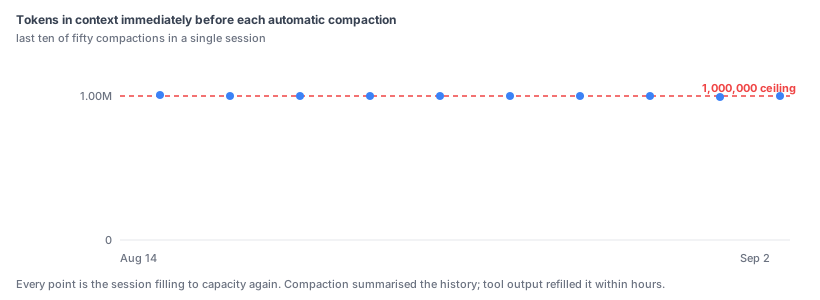
Every compaction fired at the ceiling. Which is what a ceiling is for, so at first this looked like the system working.
It isn't, and the reason is what compaction leaves behind. It replaces history with a summary, and the summary is much smaller than what it replaced, but it isn't nothing, and it sits at the front of the new context permanently. Then work resumes. Files get read, commands produce output, searches return results. The context refills, and the next compaction starts from a slightly worse position than the last.
Run that loop long enough and you're spending a growing share of your time compacting rather than working. Nothing announces this. There's no error. The session just gets progressively less responsive in a way that's easy to attribute to the model having a slow day.
There's an actual 400 in the log from an earlier month, when the refill outran the ceiling:
How I looked at it
The transcript is JSON Lines, one entry per line, which makes a 566 MB file tractable if you never load the whole thing.
That last one is the one that mattered. Sorting entries by byte length pointed straight at the problem in about two seconds, and it's the first thing I'd run on any transcript now.
The date-span line was its own small shock: eighty days between the first entry and the last, with records on 68 of them. I had genuinely thought of this as "the session I've been using this week."
What was actually eating the context
I assumed conversation. Eighty days of back-and-forth has to add up.
It doesn't, or at least not here. I sorted the transcript entries by size:
| Largest entries | What they were |
|---|---|
| 1.3 MB | a single tool result |
| 1.2 MB | a single tool result |
| 1.2 MB | a single tool result |
| 1.2 MB | a single tool result |
Every one of the largest entries was one command's output. A 1.2 MB tool result is somewhere around 300,000 tokens, nearly a third of the entire window, produced by one command that I probably glanced at and moved past.
That reframes the problem. My conversation was not too long. I had a handful of commands whose output was catastrophic, and they were scattered through two months of history where they'd been re-sent as context on every single request since.
The fix for that isn't shorter conversations. It's not letting a command dump a megabyte into the transcript in the first place: pipe it to a file, read the part you need, and let the file stay on disk where it doesn't cost anything per request.
Why nineteen minutes of nothing
Compaction is itself a large model call: the entire history goes in, a summary comes out. When the history is a million tokens, that call takes minutes.
So the nineteen minutes weren't a hang. The session was compacting, finishing, refilling, and hitting the ceiling again, while I typed "are you working" into what looked like a dead terminal. Nothing in the interface distinguishes "thinking about your question" from "summarising two months of history for the fiftieth time."
That's the part I'd call a real gap. Not that compaction is slow, but that it's invisible.
The interruptions I sent probably made it worse, too. Each one aborted whatever was in flight, and the next message started the same expensive summarisation over. I spent nineteen minutes repeatedly interrupting a process that needed to finish, because I had no way of knowing that's what it was.
I had already learned this once
Here's the part I'd rather leave out.
In late July I did this same investigation, on the same machine, for the same reason. That session was 45 days old, 296 MB, and had been compacted 32 times. I wrote up what I found and left myself a rule: a session is a unit of work; when the topic changes, start a new one.
Six weeks later I was writing the same postmortem with bigger numbers.
The rule was correct and it didn't survive contact with a Tuesday morning. When you're in the middle of something, opening a fresh session feels like a small deliberate cost, since you have to re-explain, re-open files, and rebuild the picture, while continuing feels free. The cost of continuing is real but it arrives later and is spread thin, so at every individual moment the wrong choice looks cheaper.
That asymmetry is why I stopped trying to fix this with discipline and started fixing it with a number on the screen. A rule you have to remember competes with your attention every single time. A percentage that turns amber does not.
What I put in place
Two things, both small, both about making the invisible visible.
A status line showing context usage. It reads the last usage record from the transcript and prints a percentage:
I compute it from the transcript rather than from any API field, because field names change between versions and a status line that silently stops working is worse than not having one. Reading the tail of the file is enough: 63 ms on the 566 MB transcript, since you only need the last few kilobytes.
A hook on compaction. When automatic compaction fires, it logs the session's age, transcript size and token count:
Compaction firing at all is the signal. By the time it happens you're already in the loop, and the log makes "how long have I been dragging this session" a fact rather than a feeling.
The habit that actually fixes it
The tooling is a backstop. The real change is treating a session as a unit of work rather than a container for a relationship with a tool.
I'd been keeping one session open because it had context. But after fifty compactions, what it "knew" was a summary of a summary of a summary, and the early context I was trying to preserve had been paraphrased out of existence long before. I was paying full price to carry something that was no longer there.
What actually carries context between sessions is written state: notes on disk, a project file, a commit message that explains why. Those don't degrade, they don't cost tokens per request, and a fresh session reads them in seconds.
Eighty days of session bought me nothing that a well-written file wouldn't have.
What replaced it
If a session isn't the thing that carries context, something has to be. For me it turned out to be three kinds of file, and the split matters more than the format.
Facts that stay true go in small notes on disk, one fact per file, with a one-line index that gets loaded at the start of every session. Things like which build flag this repo needs, or why a particular workaround exists. These are cheap because the index is a few hundred bytes and only the relevant note gets opened.
State of the work in progress goes in a project file: what's done, what's blocked, what the next step is. This is the one that a long session was supposedly preserving, and writing it down took four minutes and preserves it better.
Reasoning that led to a decision goes in the commit message. Not what changed, which the diff already says, but what I tried that didn't work and why the chosen approach won. Six weeks later that's the only artifact that still answers questions.
None of these degrade. A summary of a summary loses detail every round; a file says the same thing in November that it said in June. And none of them cost tokens on requests where they aren't needed.
The thing I'd tell myself in June: the value you think you're preserving by keeping a session open is mostly already gone, and the small amount that's real would fit in a paragraph.