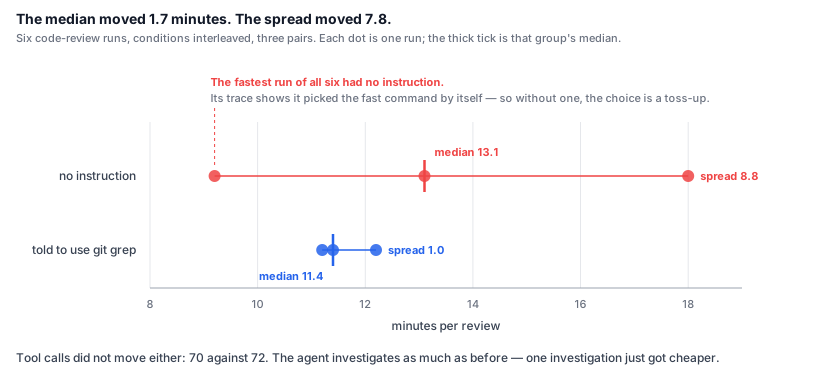
I gave a code-review agent one line about which search command to use. The median went from 13.1 minutes to 11.4, near enough to nothing.
The spread went from 8.8 minutes to 1.0.
I did not make it faster. I made it predictable, and those are different things.
First: where the time actually was
Eight repository stages pulled from recorded runs.
Review is not the tail of a run. It is half of it. So I went at review.
The expensive part is not the tool
Break down the slow steps of a single review:
The tools are effectively free. What costs is the model round trip: deciding to call, reading the result, continuing. A single review takes 57 to 88 of them.
The obvious move is to cut the number of round trips. I tried twice. Neither moved.
Attempt one: hand over the rules
The review prompt was telling the agent to read the repository's contributing guide. But that file is already loaded into context. I checked by asking an agent with no tools, and it quoted the rules without opening anything.
I was telling it to go fetch something it was already holding. I changed the sentence to say it already had it.
One call. Noise.
Attempt two: hand over the answer
The review asks the agent to find other callers of what changed. That is deterministically computable: grep the repository for references to the changed filenames, 172ms. So I computed the list and put it in the prompt.
One call again. Reverted.
What is left as an explanation
Inferred, not measured: the agent does not search because it lacks context. It searches until it is satisfied. Give it the answer and it verifies the answer.
That is an interpretation of a tool-call count that did not move, and other explanations fit. The total amount to investigate might be set by the size of the diff and be independent of context. I did not run the experiment that separates those two.
One intervention did work: putting the diff body in the prompt, 83 calls down to 69. What separates it from the other two is that it is not optional. Without the diff there is no review at all, so the agent will always go and get it. Removing a mandatory step is the thing that helps.
So: not the number of actions, the cost of one
I collected every slow step across the runs. The ones with real tool time were, without exception, recursive greps.
The second line is the interesting one. It filters node_modules downstream of grep, with a pipe. By then grep has already read every one of those files.
The reason is arithmetic:
grep -r walks a hundred and twenty-seven thousand files. git grep reads the index and looks at nine hundred.
And --include="*.js" does not save you: the filter is applied after the directory walk, not instead of it.
An earlier post timed the search commands themselves. This one is about the commands the agent actually typed.
Then I told it which one to use
Same sample, conditions interleaved, three pairs.
The tool-call count does not move, 70 against 72. The agent investigates exactly as much as before. One investigation just got cheaper. Which is what the two failures above predicted: nothing you put in front of it changes what it does, and what you can change is the price of one action.
Why the spread and not the median
Look at the control arm. One of those runs finished in 9.2 minutes, faster than anything in the treated arm, with no instruction at all. Pull its slow steps and there is the reason: that run chose git grep on its own. That is an observation, not an inference. It is in the trace.
Inferred, not measured: so tool choice without an instruction is a coin flip, and the instruction does not lower the average, it removes the flip. Good runs were always possible; the instruction makes them reliable. Three pairs is thin ground for that, and I am not claiming more.
In production a review that always takes 12 minutes beats one that averages 13 and occasionally takes 18. What jams a queue is the tail, not the mean.
Causes I eliminated
All of these were measured with the conditions interleaved, not one condition in a block and then the other. Batching them lets the drift between the blocks masquerade as the difference between the conditions. The same prompt on this machine ran anywhere from 42 seconds to 7 minutes depending on when it was timed.
| Hypothesis | Result |
|---|---|
| The prompt is too large | ❌ 20,608 chars took 9.5s; a smaller 15,828 took 42s |
| The attached tool server costs | ❌ 3.6s against 3.8s, 16 interleaved runs |
| The effort setting | ❌ four levels at 11.7 / 10.4 / 10.2 / 11.2s |
| Response length | ❌ output rate differed across all three conditions |
| The model | ❌ identical throughout |
The measurements come from one repository (a legacy admin front end in the Nuxt family) and I have not checked whether the ratio holds elsewhere. The file counts above are that repository's.